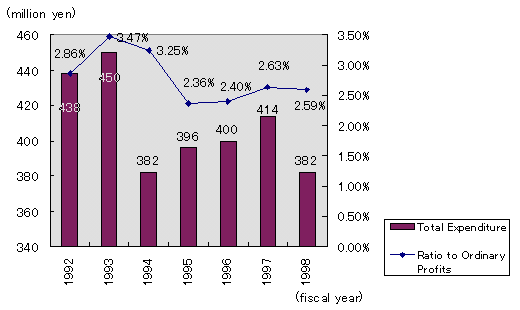
The total amount of money spent on philanthropic activities in fiscal 1998 by the 360 corporations that responded to the survey was 137.6 billion yen. This translates to an average 382 million yen expenditure per company for a 7.7% decline from the fiscal 1997 figure of 414 million yen per company.
Furthermore, the analysis of expenditures by 283 companies which participated in the survey for two consecutive years revealed that the number of companies which cut expenditures (196) exceeded the number of companies which increased expenditures (79).
As to the trends of average expenditure per company and its ratio to the ordinary profit, please refer to the Chart 1 on page 2.
Total Expenditure on Philanthropic Activities (in millions of yen)
| Fiscal Year | 1992 | 1993 | 1994 | 1995 | 1996 | 1997 | 1998 |
|---|---|---|---|---|---|---|---|
| Total Amount | 167,000 | 149,400 | 154,200 | 145,400 | 162,000 | 155,700 | 137,600 |
| (Number of companies) | (381) | (398) | (404) | (367) | (405) | (376) | (360) |
| Average per company | 438 | 450 | 382 | 396 | 400 | 414 | 382 |
| (Growth Rate) | (-16.6%) | (-7.5%) | (-5.7%) | (+3.8%) | (+1.0%) | (+3.5%) | (-7.7%) |
Among the 295 respondents to the question regarding the ratio of philanthropic expenditures to ordinary profit in fiscal 1998, the ratio per company on a simple average was 2.59%. This figure is down 0.04 points from the data collected for fiscal 1997 and reflects the drop in philanthropic expenditures. Moreover, the ratios for philanthropic expenditures to total sales figures and to pretax profits also fell below the corresponding figures collected for fiscal 1997 and proved to be the lowest ever recorded.
The Ratio of Expenditure on Philanthropy Activities to Total
Sales, Ordinary profits and Pretax Profits (Simple Average)
| Fiscal Year | 1992 | 1993 | 1994 | 1995 | 1996 | 1997 | 1998 |
|---|---|---|---|---|---|---|---|
| Ratio to Total Sales | 0.15% | 0.21% | 0.17% | 0.16% | 0.18% | 0.12% | 0.10% |
| (Number of companies) | (327) | (321) | (347) | (341) | (384) | (363) | (342) |
| Ratio to Ordinary Profits | 2.86% | 3.47% | 3.25% | 2.36% | 2.40% | 2.63% | 2.59% |
| (Number of companies) | (343) | (315) | (333) | (326) | (368) | (337) | (295) |
| Ratio to Pretax Profits | 3.24% | 4.25% | 3.50% | 3.30% | 2.88% | 2.97% | 2.70% |
| (Number of companies) | (330) | (310) | (318) | (312) | (350) | (319) | (256) |
Chart 1: The trend of average expenditure on philanthropic activities and its ratio to ordinary profit
After asking the total expenditure, the questionnaire delved into how much of the expenditures were comprised of donations and how much were comprised of money spent supporting the corporation's independent programs (money spent enacting philanthropic programs designed by the corporation).
A. Donations
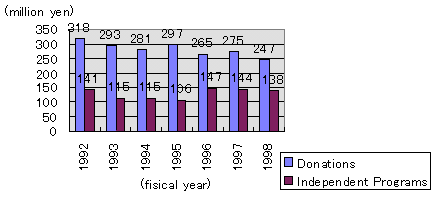
Within the philanthropic expenditures, average donations per company in fiscal 1998 was 247 million yen for a 10.2% drop from fiscal 1997.
Total Donations (in millions of yen)
| Fiscal Year | 1992 | 1993 | 1994 | 1995 | 1996 | 1997 | 1998 |
|---|---|---|---|---|---|---|---|
| Total Amount | 120,700 | 107,400 | 112,800 | 107,100 | 104,900 | 102,700 | 88,300 |
| (Number of companies) | (380) | (366) | (402) | (360) | (396) | (373) | (357) |
| Average per company | 318 | 293 | 281 | 297 | 265 | 275 | 247 |
| (Growth Rate) | (-15.9%) | (-7.9%) | (-4.1%) | (+6.0%) | (-10.8%) | (+3.9%) | (-10.2%) |
B. Expenditures on Corporate Independent Programs
Within the philanthropic expenditure figures, among the 357 respondents the average amount per company spent on independent programs was 138 million yen for a 4.2% drop from fiscal 1997. Nevertheless, the ratio of money devoted to expenditures on corporate independent programs within the total philanthropic expenditures has remained at a high level for the past number of years.
Expenditure on Independent Programs (in millions of yen)
| Fiscal Year | 1992 | 1993 | 1994 | 1995 | 1996 | 1997 | 1998 |
|---|---|---|---|---|---|---|---|
| Total Amount | 46,300 | 42,000 | 41,300 | 38,300 | 57,100 | 53,000 | 49,300 |
| (Number of companies) | (329) | (365) | (361) | (361) | (387) | (367) | (357) |
| Average per company | 141 | 115 | 115 | 106 | 147 | 144 | 138 |
| (Growth Rate) | (-40.5%) | (-18.4%) | (0.0%) | (-7.8%) | (+38.7%) | (-2.1%) | (-4.2%) |
Chart 2: Average donations and independent programs per company
C. Uses of Donations and Money Spent in Independent Philanthropic Programs
Upon classifying the ratio of donation expenditures by category, one sees that the high ratio fields were either categories requiring specialist knowledge such as academic research at 19.8% and education at 12.3% or regional societal activities at 14.1%.
On the other hand, the fields which had a high ratio of expenditures in regards to corporate independent programs were art and culture at 21.1%, regional societal activities at 18.5%, environmental protection at 12.2%, etc. The wide-margin growth of the environmental protection field was especially prominent.
| Donations | Independent Programs | ||||||
|---|---|---|---|---|---|---|---|
| Percentage of the Total for Fiscal 1998 (Number of companies: 329) |
Percentage of the Total for Fiscal 1997 | Percentage of the Total for Fiscal 1998 (Number of companies: 186) |
Percentage of the Total for Fiscal 1997 | ||||
| (1) | Social Welfare | 7.10% | 8.90% | (iv) | 10.30% | 10.90% | |
| (2) | Health/Medicine | 6.10% | 5.30% | 5.30% | 4.30% | ||
| (3) | Sports | 6.10% | 8.10% | (v) | 9.80% | 10.20% | |
| (4) | Academic Research | (i) | 19.80% | 17.60% | 5.20% | 6.00% | |
| (5) | Education | (iii) | 12.30% | 14.30% | 8.90% | 9.60% | |
| (6) | Arts/Culture | (v) | 9.50% | 8.30% | (i) | 21.10% | 22.70% |
| (7) | Environmental Protection | 4.80% | 5.00% | (iii) | 12.20% | 9.60% | |
| (8) | Preservation of Historical Site and Traditional Culture | 2.30% | 2.50% | 1.20% | 1.50% | ||
| (9) | Community Involvement | (ii) | 14.10% | 13.00% | (ii) | 18.50% | 16.40% |
| (10) | International Exchange/Cooperation | 5.80% | 5.90% | 3.30% | 4.40% | ||
| (11) | Disaster Aid | 1.20% | 1.10% | 1.20% | 0.20% | ||
| (12) | Others | (iv) | 11.00% | 10.00% | 3.20% | 4.10% | |
The application rate (simple average) of the tax exemption limit to donations was 51.0% for general donations and 22.9% for Designated Public Interest Organizations, both of which were 4-5% below the same figures recorded for fiscal 1997.
Moreover, the number of companies which reached 100% of the application rate of the tax exemption limit was 42 (13.5% of total respondents) for general donations and 13 (4.3% of total respondents) for Designated Public Interest Organizations.
The Ratio of Donations to Tax Exemption Limits (Simple Average)
| Fiscal Year | 1992 | 1993 | 1994 | 1995 | 1996 | 1997 | 1998 |
|---|---|---|---|---|---|---|---|
| Average Ratio to General Tax Exemption Limit | 50.2% | 47.0% | 48.8% | 52.8% | 51.2% | 55.1% | 51.0% |
| (Companies responding) | (333) | (307) | (329) | (286) | (328) | (324) | (312) |
| Average Ratio to Tax Exemption Limit of Donations to Designated Public Interest Org. | 24.6% | 24.8% | 27.2% | 29.1% | 24.8% | 27.8% | 22.9% |
| (Companies responding) | (330) | (298) | (318) | (269) | (313) | (315) | (302) |
The Number of Corporations Which Gave Donations up to the 100% of Tax Exemption Limit
| Fiscal Year | 1992 | 1993 | 1994 | 1995 | 1996 | 1997 | 1998 |
|---|---|---|---|---|---|---|---|
| General Tax Exemption Limit | 56 corp. | 42 corp. | 30 corp. | 25 corp. | 34 corp. | 51 corp. | 42 corp. |
| (Ratio to companies responding) | (16.8% of 333 corp.) | (13.7% of 307 corp.) |
(9.1% of 329 corp.) | (8.7% of 286 corp.) |
(10.4% of 328 corp.) | (15.7% of 324 corp.) |
(13.5% of 312 corp.) |
| Tax Exemption Limit of Donations to Designated Public Interest Org. | 22 corp. | 20 corp. | 22 corp. | 12 corp. | 19 corp. | 20 corp. | 13 corp. |
| (Ratio to companies responding) | (6.7% of 330 corp.) | (6.7% of 298 corp.) |
(6.9% of 318 corp.) | (4.5% of 269 corp.) |
(6.2% of 313 corp.) | (6.3% of 315 corp.) |
(4.3% of 302 corp.) |
Philanthropic activity promotion organizations within the Corporate Structure
The number of companies which established some types of philanthropic activity promotion organization was 213, or 56.3% of all responding companies. In particular, companies with "documentation of basic policies" (148) and "organization of an exclusive department or appointment of a director in charge of corporate philanthropy" (123) stand out.
| Fiscal Year | - 1991 | 1992 | 1993 | 1994 | 1995 | 1996 | 1997 | 1998 | Total |
|---|---|---|---|---|---|---|---|---|---|
| Number of corporations that induced system | 114 | 49 | 24 | 25 | 26 | 21 | 30 | 27 | 213 |
| Documentation of basic policies | 59 | 24 | 13 | 11 | 8 | 5 | 16 | 12 | 148 |
| Organization of an exclusive department or appointment of a director | 49 | 18 | 13 | 8 | 8 | 6 | 15 | 6 | 123 |
| Appointment of a director in branches | 9 | 9 | 3 | 3 | 3 | 5 | 3 | 6 | 41 |
| Establishment of a corporate philanthropy committee | 27 | 10 | 6 | 1 | 4 | 7 | 8 | 4 | 67 |
| Making the budget for philanthropic activities | 37 | 8 | 4 | 2 | 7 | 1 | 8 | 4 | 71 |
| Establishment of money conversion rules | 14 | 5 | 2 | 3 | 3 | 1 | 4 | 0 | 32 |
| Others | 4 | 9 | 1 | 3 | 1 | 2 | 2 | 3 | 25 |
| Total | 199 | 83 | 42 | 31 | 34 | 27 | 56 | 35 |
Programs to support the philanthropic activities of employees
When looking at the data to discern conditions for companies introducing programs to aid personnel in participating in philanthropic activities, one sees that around half of the respondents at 205 companies have introduced some sort of program.
Especially striking is the number of firms setting up programs giving employees time off for volunteer activities at 98 cases and the number of firms giving employees time off to participate in the Japanese version of the Peace Corps at 78 cases.
Moreover, within the category labeled "Other," there were a large number of companies that had introduced corporate systems to aid in donating capital to purchase supplies or pay a portion of transportation expenses to groups performing volunteer activities when those groups included company employees or family members of company employees.
| Fiscal Year | - 1991 | 1992 | 1993 | 1994 | 1995 | 1996 | 1997 | 1998 | Total |
|---|---|---|---|---|---|---|---|---|---|
| Number of corporations that induced system | 71 | 51 | 34 | 36 | 32 | 28 | 33 | 23 | 205 |
| Volunteer leave system | 6 | 15 | 9 | 8 | 5 | 4 | 7 | 3 | 57 |
| Japan Overseas Cooperation participation leave system | 27 | 14 | 9 | 12 | 3 | 4 | 5 | 4 | 78 |
| Volunteer time-off system | 6 | 21 | 13 | 10 | 15 | 13 | 13 | 7 | 98 |
| Local community activity time-off system | 3 | 6 | 7 | 3 | 2 | 0 | 1 | 1 | 23 |
| Volunteer activist recognition system | 12 | 7 | 2 | 7 | 1 | 4 | 5 | 3 | 41 |
| Volunteer registration system | 2 | 2 | 5 | 7 | 7 | 5 | 4 | 3 | 35 |
| Matching gift system | 5 | 14 | 5 | 1 | 4 | 4 | 3 | 4 | 40 |
| Local community contribution activity campaign | 23 | 9 | 4 | 0 | 2 | 1 | 7 | 3 | 49 |
| Others | 5 | 4 | 2 | 3 | 4 | 2 | 4 | 10 | 34 |
| Total | 89 | 92 | 56 | 51 | 43 | 37 | 49 | 38 |