A total of 36 industries 1 participated in the 4th Follow-up, reflecting the addition of two new industries (Japan Auto-Body Industries Association, Inc. and the Japan Sanitary Equipment Industry Association).
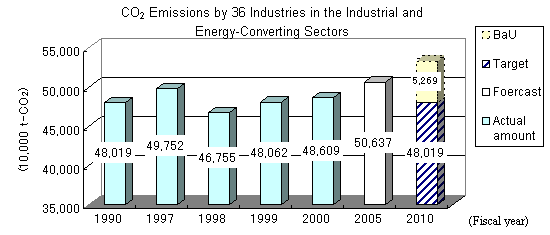
These 36 industries emitted 480.19 million t-CO2 in fiscal 1990 2, equivalent to around 42.7% of the 1.1244 billion t-CO2 emitted by Japan as a whole during that year. Moreover, the emissions of the 36 industries represented approximately 76.7% of the total amount of CO2 emitted by the country's industrial and energy-converting sectors in fiscal 1990 (626.0 million t-CO2 3).
Keidanren has declared "to endeavor to reduce CO2 emissions from the industrial and energy-converting sectors in fiscal 2010 to below the levels of fiscal 1990," and industries and companies are striving to achieve this target.
Results of the 4th Follow-up indicate that CO2 emissions in fiscal 2000 were 486.09 million t-CO2, a 1.1% increase compared to fiscal 1999 and a 1.2% increase compared to fiscal 1990.
According to results in the current follow-up, CO2 emissions in fiscal 2005 will be 563.7 million t-CO2 (approximately 5.5% higher than in fiscal 1990); on a business-as-usual basis, CO2 emissions in fiscal 2010 will increase to 532.88 million t-CO2 (+11% compared to fiscal 1990).
|
Of the 36 industries in the industrial and energy-converting sectors that participated in the current compilation, 23 reported declines in CO2 emissions compared to fiscal 1990, while 15 reported declines compared to fiscal 1999. Of the 13 industries that defined their goals in terms of reductions of CO2 emissions, 11 reported reductions compared to fiscal 1990 and 9 reported reductions compared to fiscal 1999 (see Attachment 1-1) 6.
4 of the 4 industries that defined their goals in terms of reduction of energy consumption reported reductions compared to fiscal 1990; 2 of these industries also reported reductions compared to fiscal 1999 (see Attachment 1-2) 7.
Of the 22 industries that defined their goals in terms of either CO2 emissions per unit output or energy input per unit output, 17 reported improvements in their indices compared to fiscal 1990; and 10 showed improvements in these indices compared to fiscal 1999 (see Attachment 1-3) 8.
To date 9 industries from the transportation, offices and household sectors have participated in the Keidanren Voluntary Action Plan, formulating voluntary action plans and endeavoring to take steps to deal with global warming. In the latest Follow-up, there was additional participation from the following: from the offices and household sector, 3 new industries (Japan LP Gas Association, Japan Association of Refrigerated Warehouses, and the Bankers Association) and one group (NTT Group); and from the transportation sector, 6 companies (Kyushu Railway Company, Shikoku Railway Company, Central Japan Railway Company, West Japan Railway Company, East Japan Railway Company, and Hokkaido Railway Company) 9 (See Attachment 2).
(1) Areas of improvement from the previous follow-up
The 4th Follow-up improved on the 3rd Follow-up in the following ways.- Increase in number of participating industries (industrial associations and companies) from 43 to 48, with participation coming not only from the industrial sector-which added 2 new industries-but also from the transportation, offices and household sectors-which added 3 new industries.
- Increase in coverage rate (76.7% of all emissions generated by the industrial and energy-converting sectors in fiscal 1990, compared to 76.5% in the previous survey).
- Increase in scope of data released (for the first time, data on amounts of energy consumed was compiled and released)
- Improvement in content of individual industry reports (in addition to analyzing factors that contributed to increases or decreases in CO2 emissions by industry, the Follow-up also provides fuller explanations of the premises underlying each industry's calculations of forecasts and goals for fiscal 2010, and of methods by each industry to calculate CO2 emissions)
(2) Evaluation of efforts by industry as a whole
CO2 emissions in fiscal 2000 were 1.2% higher than in fiscal 1990. As it did in the previous Follow-up, Keidanren analyzed factors that caused increases or decreases in CO2 emissions by Japanese industry generally. This analysis showed that although efforts by industry resulted in larger reductions of CO2 (-2.1% in fiscal 1999 versus -4.1% in fiscal 2000) this year than last, CO2 emissions related to economic factors such as increased production (+4.2% vs. +7.5%) grew at a faster rate, leading to the overall 1.2% increase in CO2 emissions (See Attachment 3).
In fiscal 2000, energy consumption was 5.7% higher than in fiscal 1990 (versus the 1.2% increase in CO2 emissions), indicating that measures by industry to reduce CO2 emissions (shifts to less carbon intensive forms of energy) were taking increased effect. Although industries and companies are endeavoring to reduce their emissions of CO2 in this way, increases generated by higher production associated with a stronger economy appear to have outweighed these reductions.
(3) Future Policies
While calling upon participating industries to remain committed to efforts to achieve their individual goals, Keidanren will work toward achieving the common goal set for all industries, namely "to endeavor to reduce CO2 emissions from the industrial and energy-converting sectors in fiscal 2010 to below the level of fiscal 1990."
Although economic expansion contributed significantly to a 1.2% increase in CO2 emissions in fiscal 2000, industries and companies are achieving steady improvements in their indices of CO2 emissions per unit output and of energy input per unit output; they are also sustaining their shift toward greater use of less carbon intensive forms of energy. Consequently, anti-global warming measures by industry should continue to be based hereafter on voluntary efforts.
The Keidanren Voluntary Action Plan on the Environment is an ongoing process in which efforts are being made each year to expand the number of participating industries and to increase the amount of information that is disclosed; in addition attempts to assure greater reliability are also underway through the use of reviews by deliberative councils and other means. While it will continue such efforts to assure reliability hereafter, Keidanren is also examining an idea to establish a domestic registration agency whose aim will be to enable industry to continue its efforts to reduce emissions over the medium-to-long terms within the framework of voluntary action plans. One of the ideas being considered under this proposed scheme is the establishment of a system of third-party certification that would be conducted by the private sectors. 10
Over the long term, the success of measures to deal with global warming will rest critically on technological development. The aim of industry will thus be not only to apply such technological development to the reduction of CO2 emissions from the industrial sector; it will also be to continue to contribute to reduction of emissions from the transportation, offices and household sector.